

This data snapshot is a selected set of indicators designed to help advocates, policymakers, and other stakeholders better understand the child welfare system in Pennsylvania. The data are organized into three sections: (1) children and families in Pennsylvania, (2) child welfare involvement, and (3) foster care. Together, these indicators provide context on the children and families in Pennsylvania, how families become involved with the child welfare system, and how the system responds to children and youth who experience foster care. Readers can refer to the accompanying source notes for definitions, guidance on interpreting the data, and additional information about each measure.
Children and families live in a wide range of community, economic, and social circumstances that can influence family stability and well-being. Although most children will never become involved with the child welfare system, research has identified certain conditions that are associated with greater likelihood of child welfare involvement, including poverty, housing instability, behavioral health challenges, and unmet service needs.
The data in this section provide general information about children in Pennsylvania, including demographic characteristics, where children live, and selected indicators related to economic well-being and behavioral health. Together, these measures provide important context for understanding the experiences of children and families.
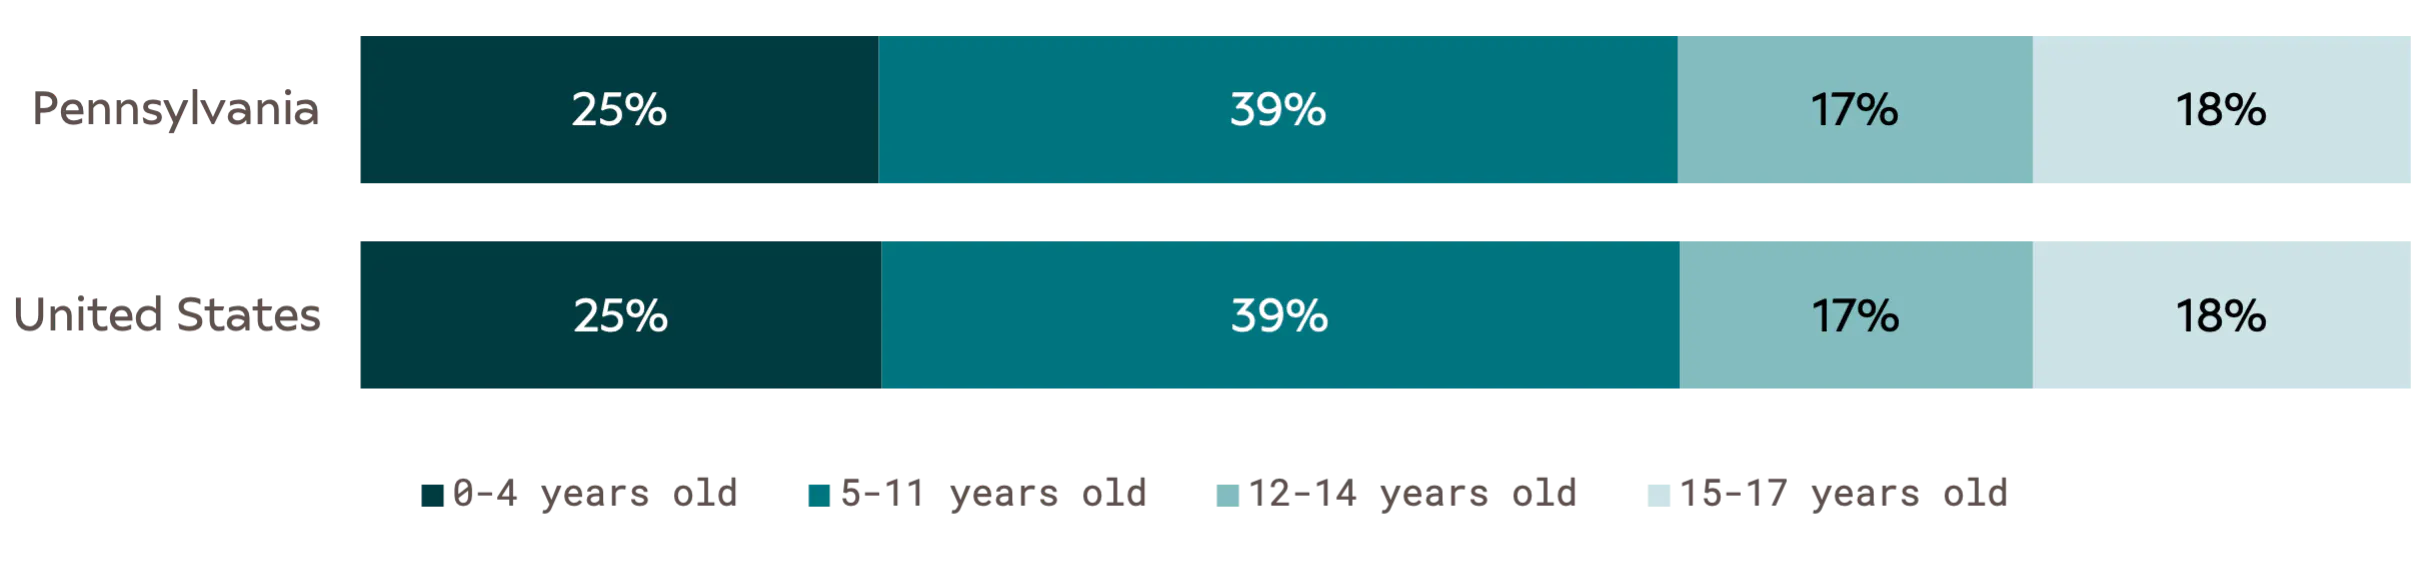
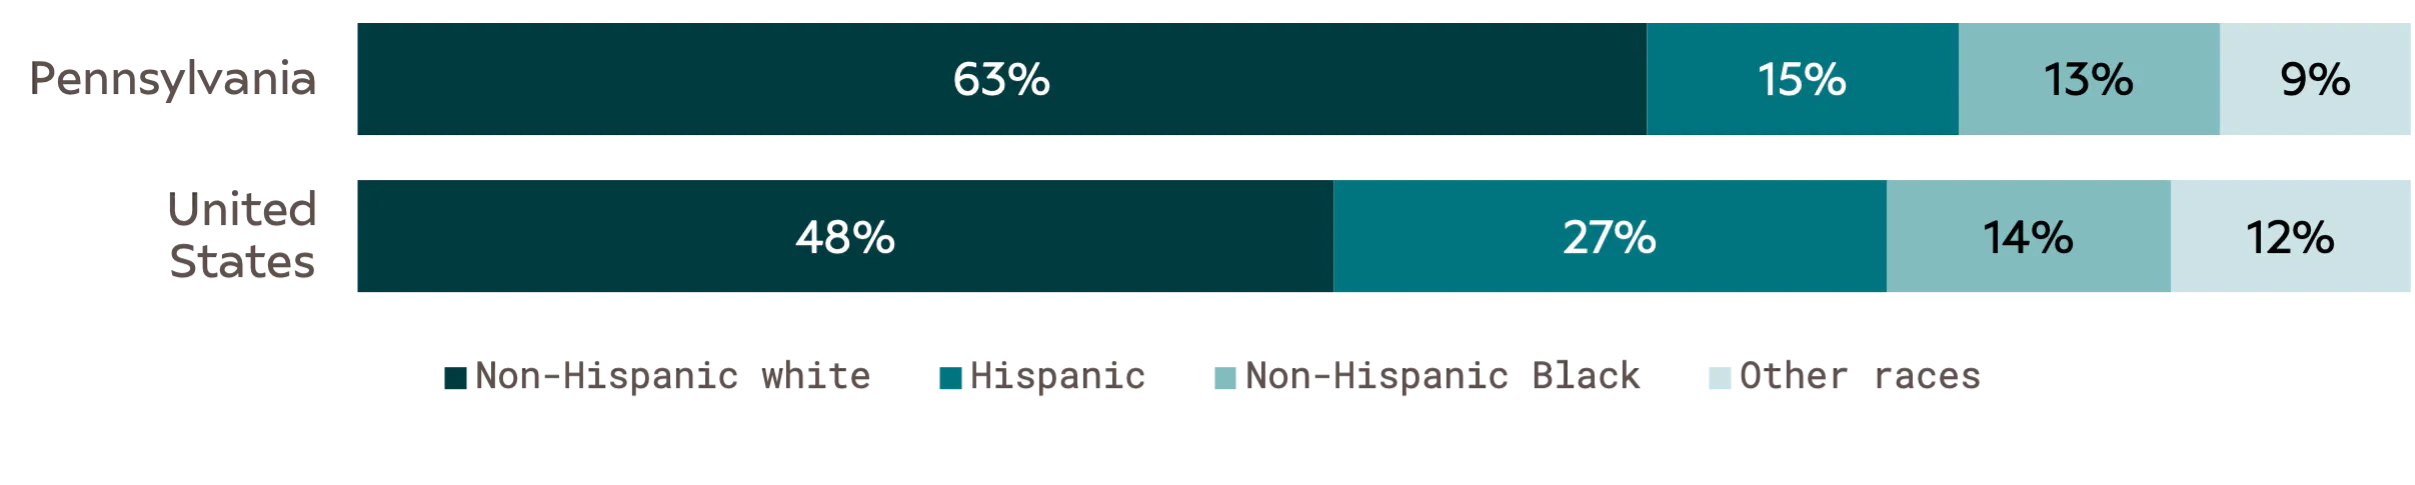
Key Finding: In 2024, about 2.6 million children aged 0-17 lived in Pennsylvania. A majority (63%) were White and not Hispanic. Most lived in urban or suburban areas.
Age of Children Aged 0 to 17, 2024
Race/Ethnicity of Children Aged 0 to 17, 2024
Residence of Children Aged 0 to 17, 2023

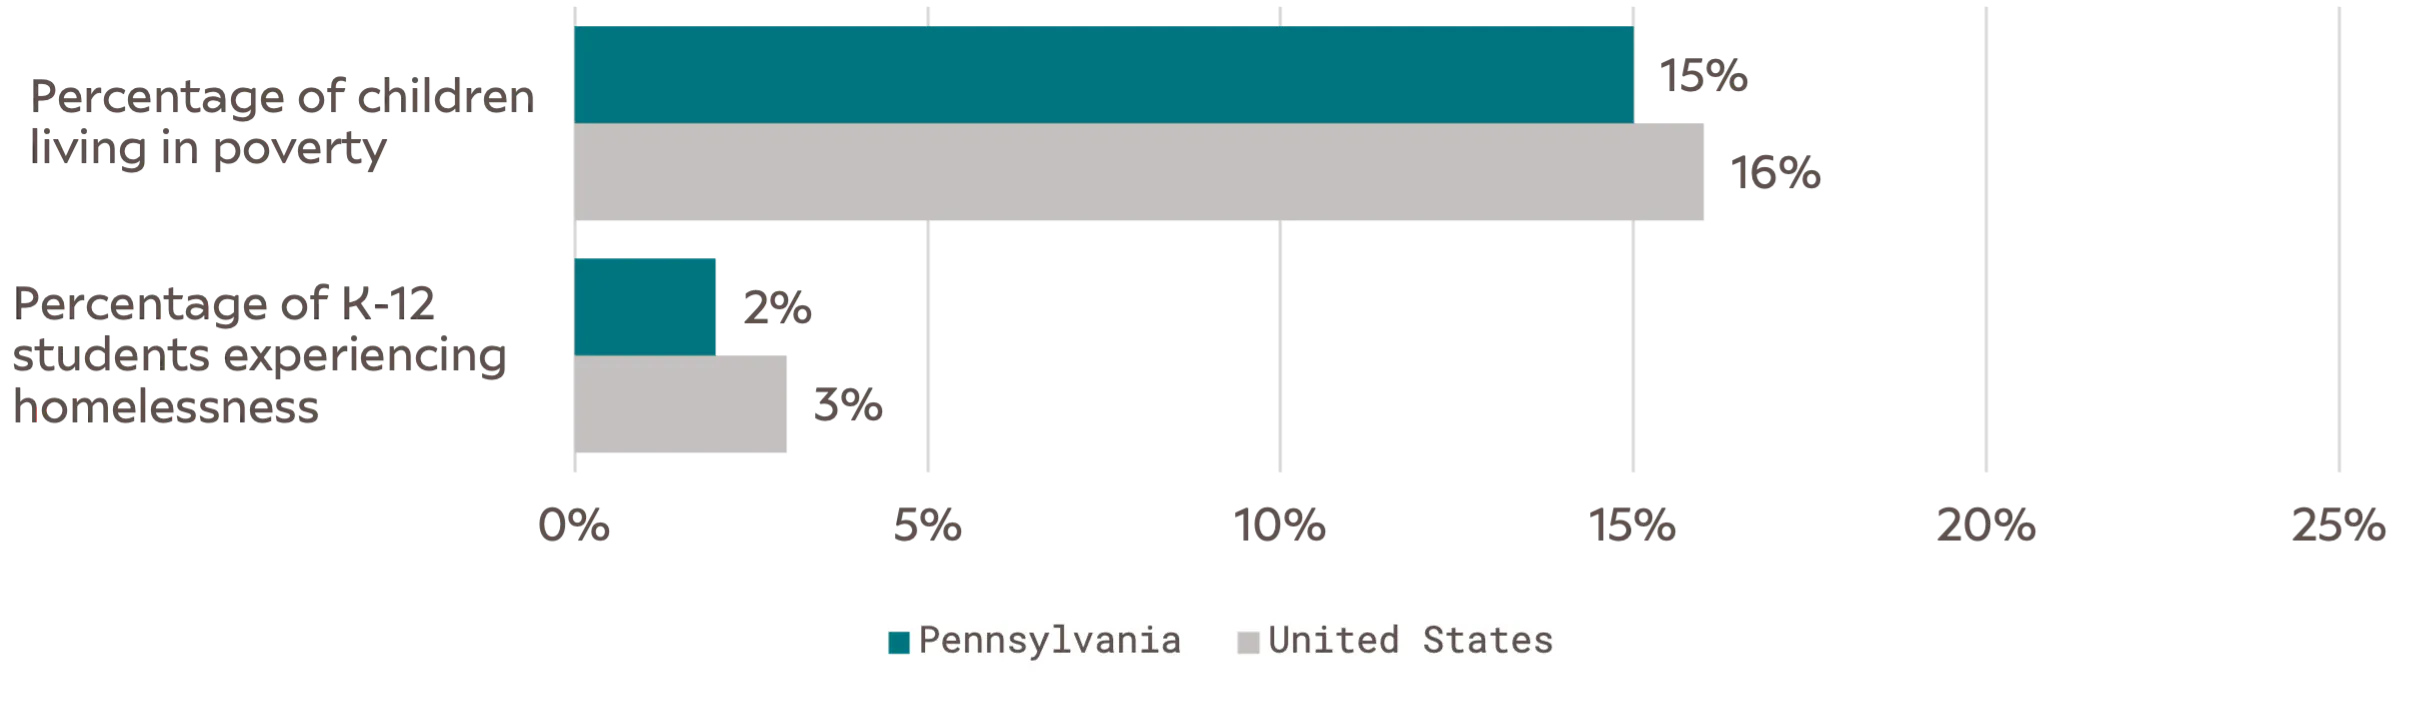
Children/Students Experiencing Poverty and Homelessness, 2024
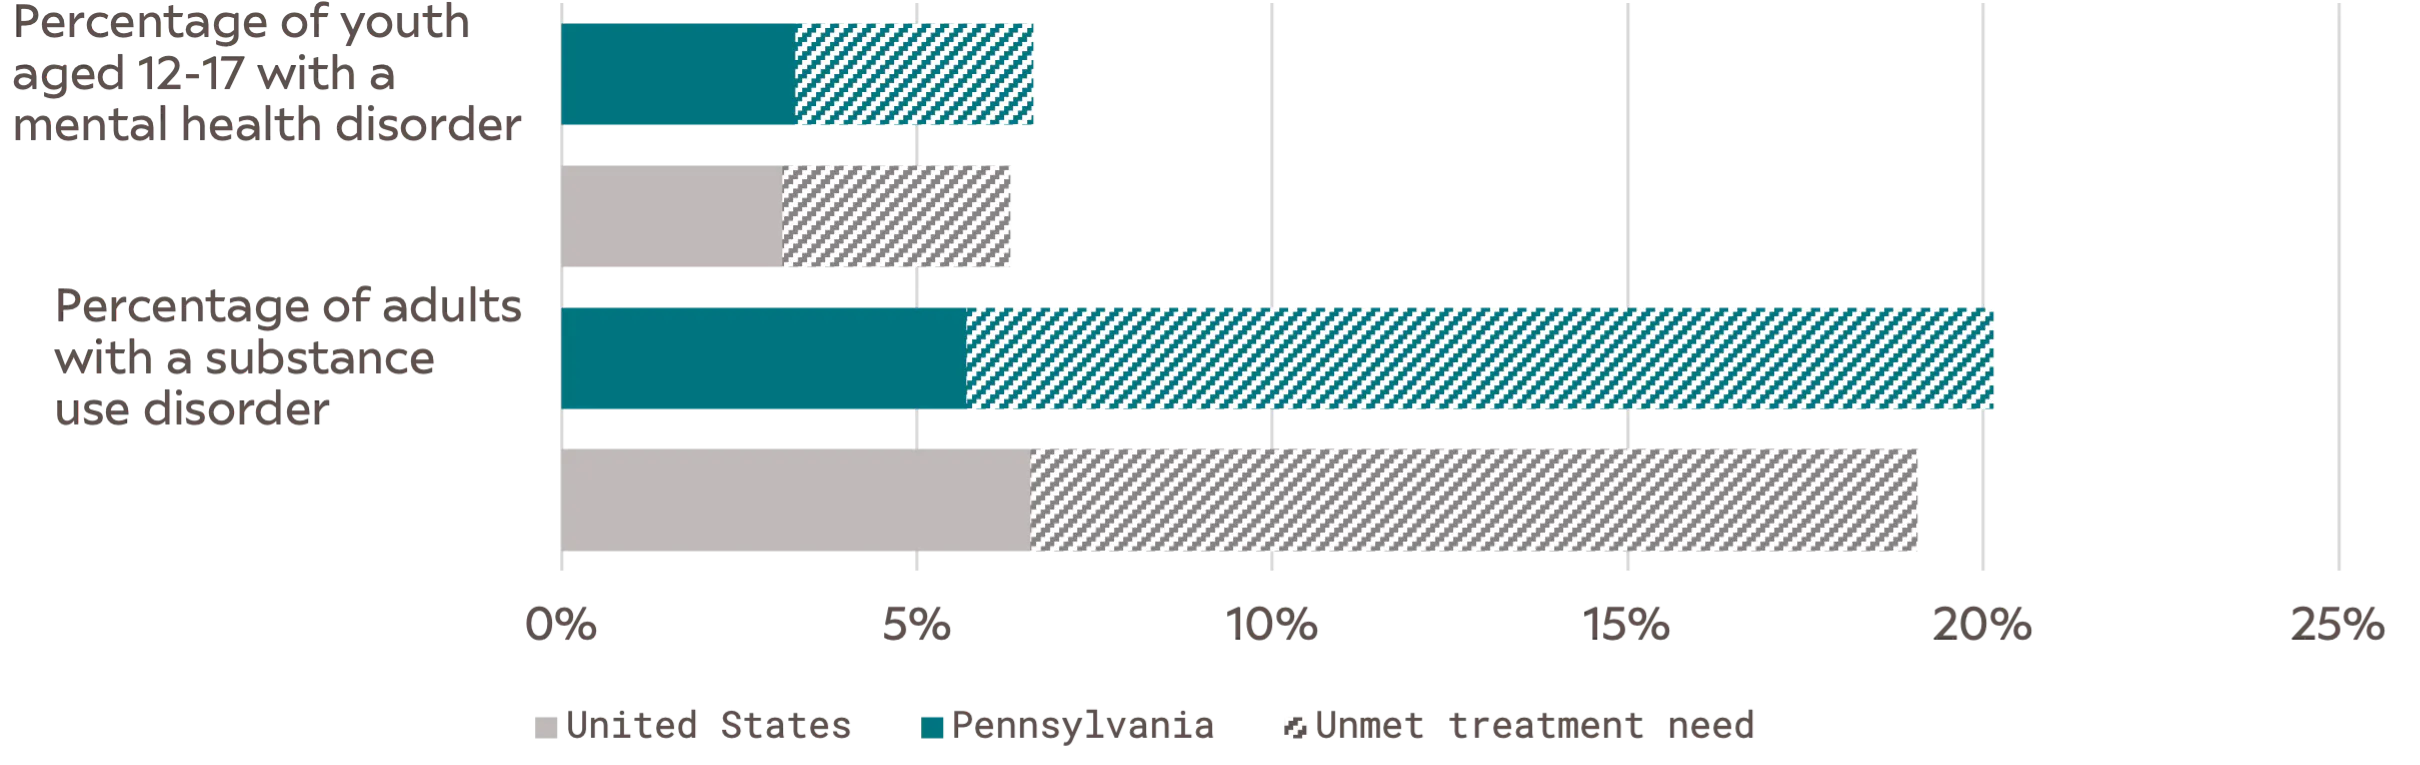
Mental Health and Substance Use Challenges, 2024

Child welfare systems typically become involved with families following a report of suspected child abuse or neglect. Child welfare agencies are responsible for receiving and screening reports, determining the appropriate response, and providing services when needed. Depending on the individual circumstances, state law and agency policy, a report may be screened out or screened in and referred for service, assessed, investigated, or substantiated for maltreatment.
The data in this section illustrate key points in the child welfare process, including referral rates, substantiation rates, and service utilization among families involved with the system. These measures help describe how families come to the attention of the child welfare system and how agencies respond once involvement occurs.
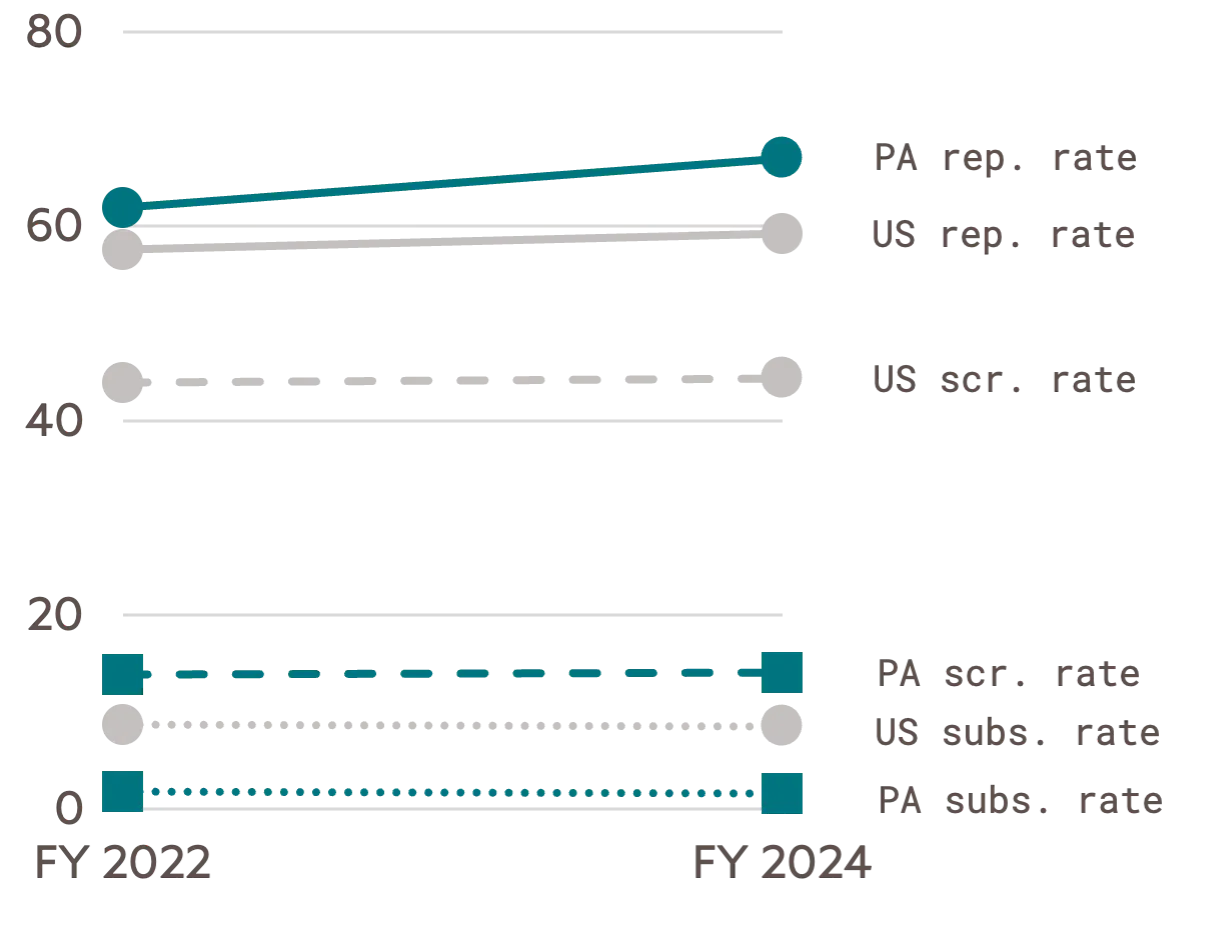
Key Finding: In 2024, for every 1,000 children in Pennsylvania, there were 67 general protective service reports.
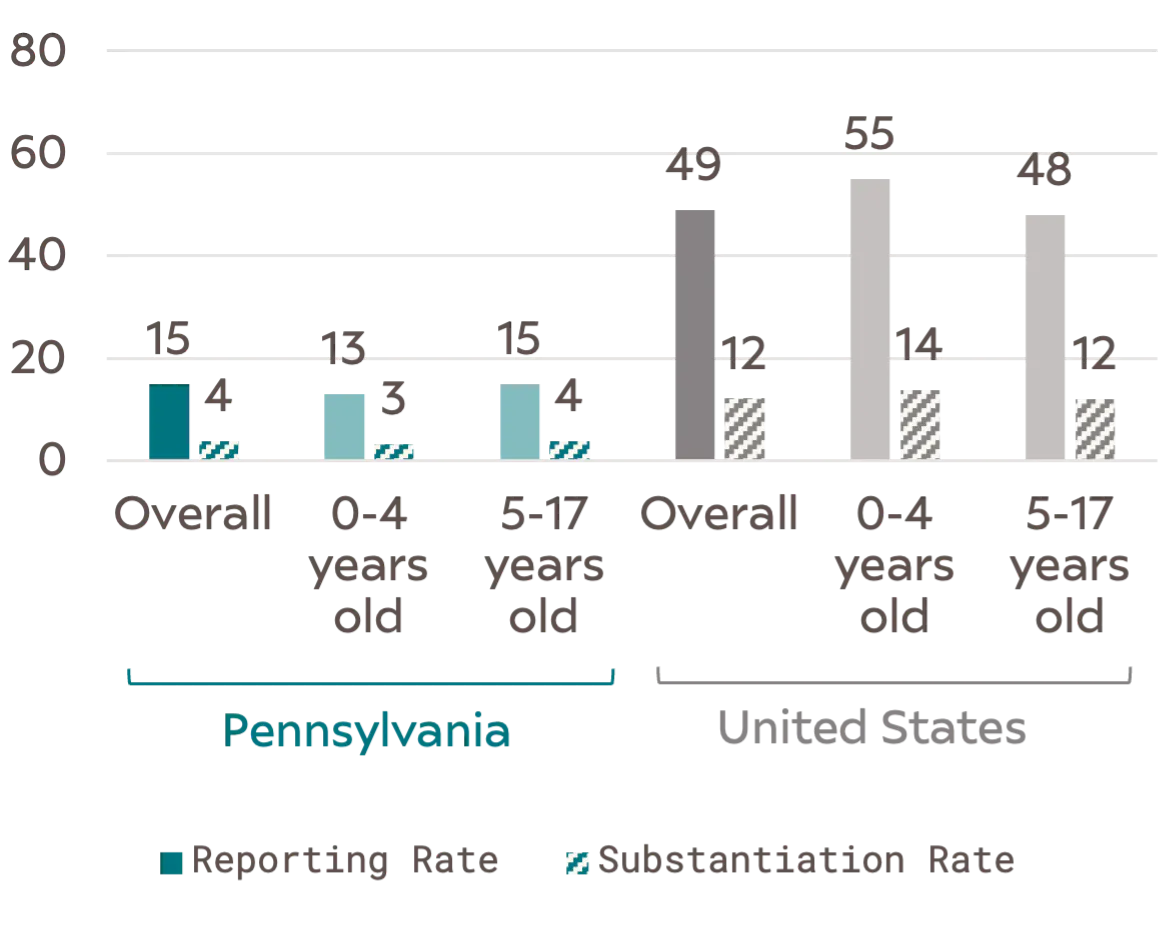
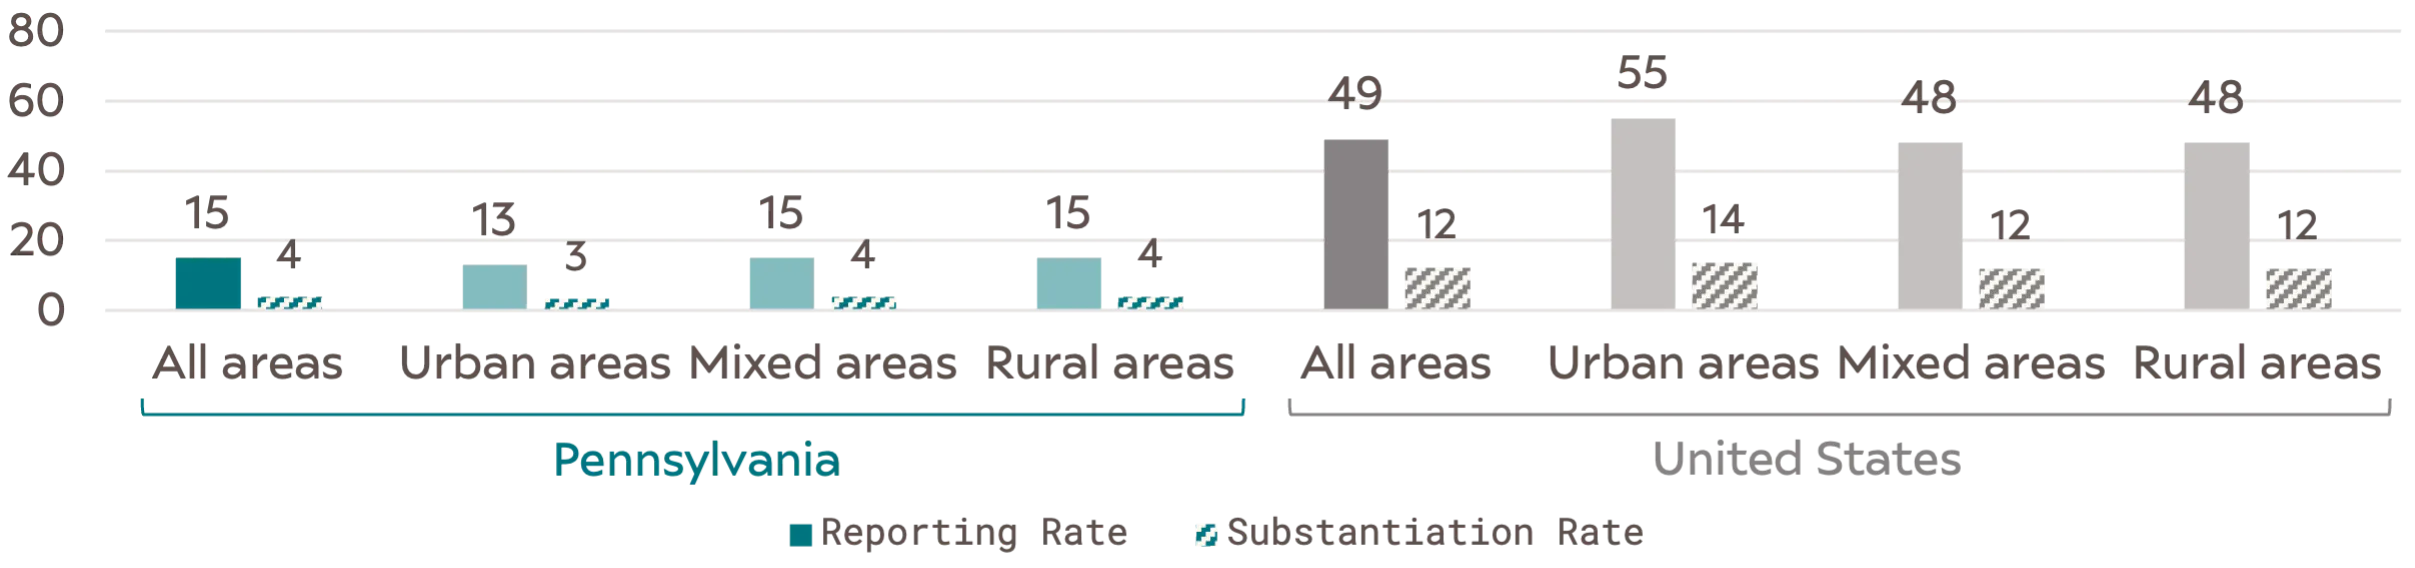
Key Finding: Not all reports are screened in for investigation or supports. In 2024, for every 1,000 children in Pennsylvania, 15 were subjects of a screened-in report.
Pennsylvania’s reporting rate was 13 per 1,000 children aged 4 or younger and 15 per 1,000 children aged 5 or older. The US rates were 55 and 48 respectively.
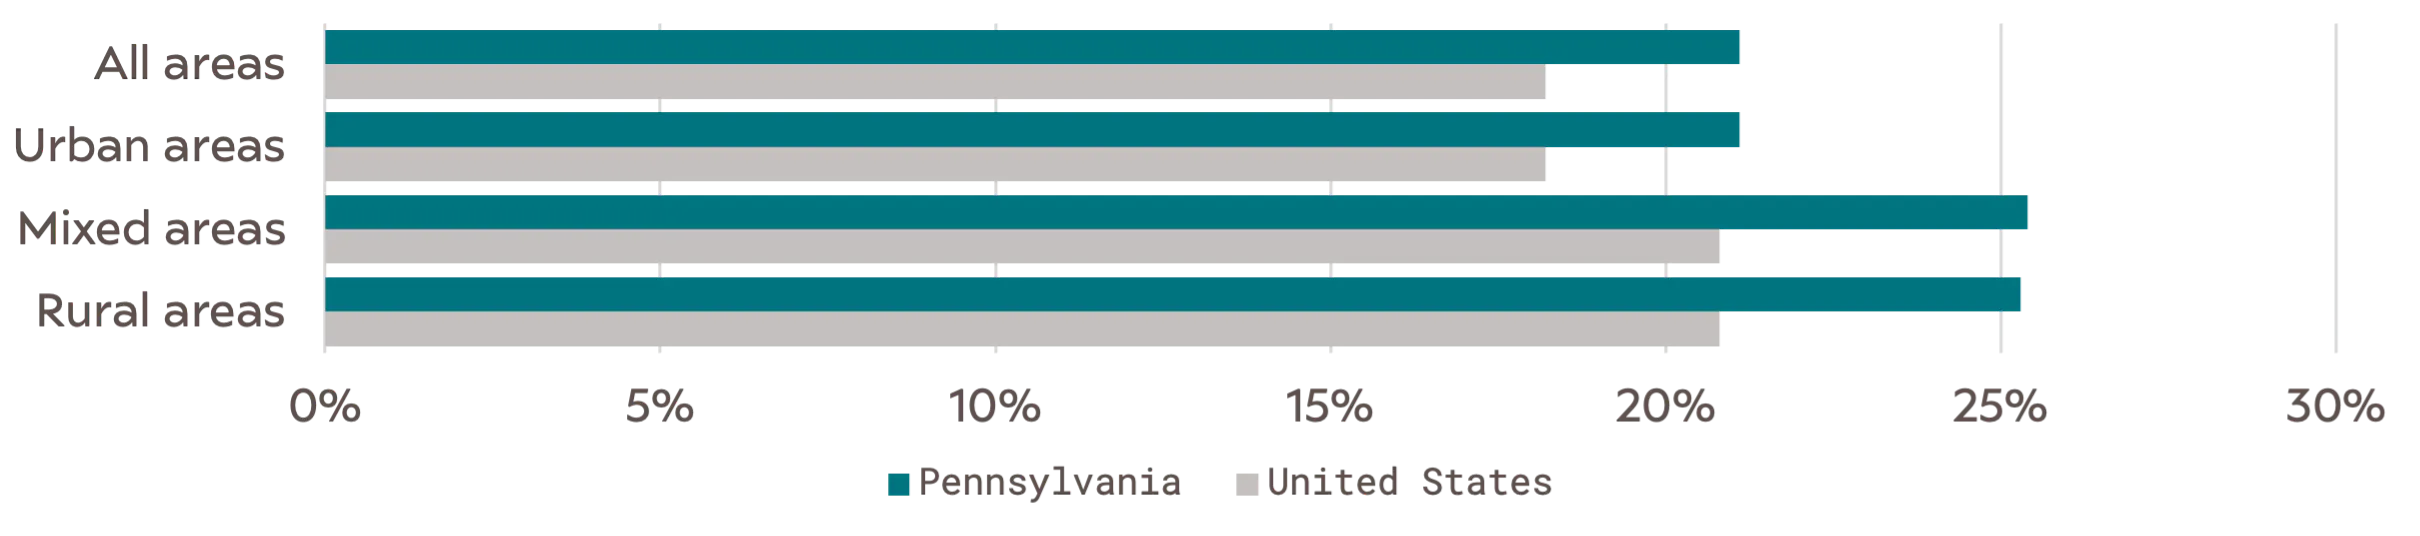
Key Finding: In Pennsylvania’s 2024 fiscal year, 12% of child welfare reports that were screened in for investigation were substantiated for maltreatment. This is lower than the US rate of 19%.
Reports to Child Welfare, Screened-in Reports, and Substantiation, Rate per 1,000 Children, FY 2022 and 2024
Screened-in Reports to Child Welfare and Substantiation, Rate per 1,000 Children by Age Group, FY 2024
Screened-in Reports to Child Welfare and Substantiation, Rate per 1,000 Children by Residence, FY 2024
Percentage of Screened-in Child Welfare Reports That Are Substantiated by Residence, FY 2024
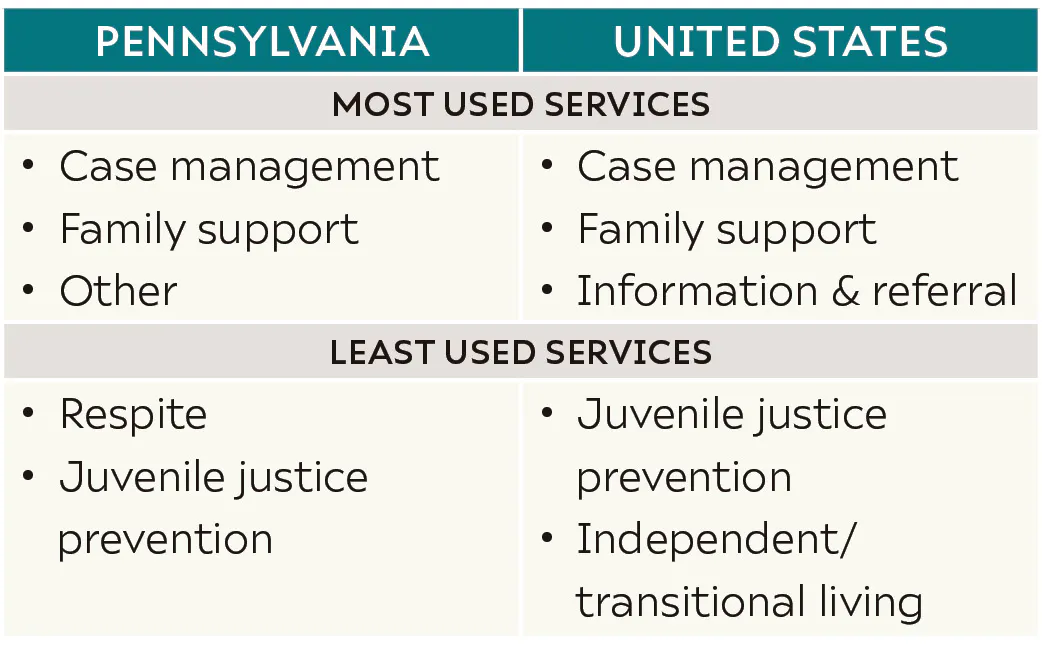
Key Finding: States have the option of reporting on services used by families who have come into contact with the child welfare system. Although most states report on some of the services, few consistently report on all service options. In 2024, 7% of Pennsylvania families who experienced a child welfare investigation received one or more supportive services within 90 days. This is lower than the U.S. average of 28%.
Services Used by Families Experiencing a Child Welfare Investigation, FY 2024?
Key Finding: Through the Family First Prevention Services Act, states can leverage federal funds to serve eligible families with evidence-based services that prevent entry into foster care. In fiscal year 2023, Pennsylvania spent around $3.4 million on their Family First program, which included around $1.7 million of federal funds. On average, states with approved prevention plans spent about $XX of combined state and federal funding on Family First programs.
Key Finding: In 2022, for every $1 that a U.S. state spent on foster care, it spent an average of $0.01 on efforts to prevent foster care placement.

When a child cannot safely remain in their home, child welfare agencies may arrange foster care placement. Foster care can occur in a variety of settings, including kinship caregiving, non-relative foster families, congregate care (group) settings, and supervised independent living arrangements. Foster care is intended to provide temporary care and safety while agencies work in a timely way toward a permanent living arrangement for the child.
The data in this section show the number of children entering foster care, the reasons children are removed from their homes, the type of foster care placements for children, how long they remain in care, and how they exit the system. This section also includes information about transition-age-youth, who may receive specialized services and supports to help them prepare for adulthood.
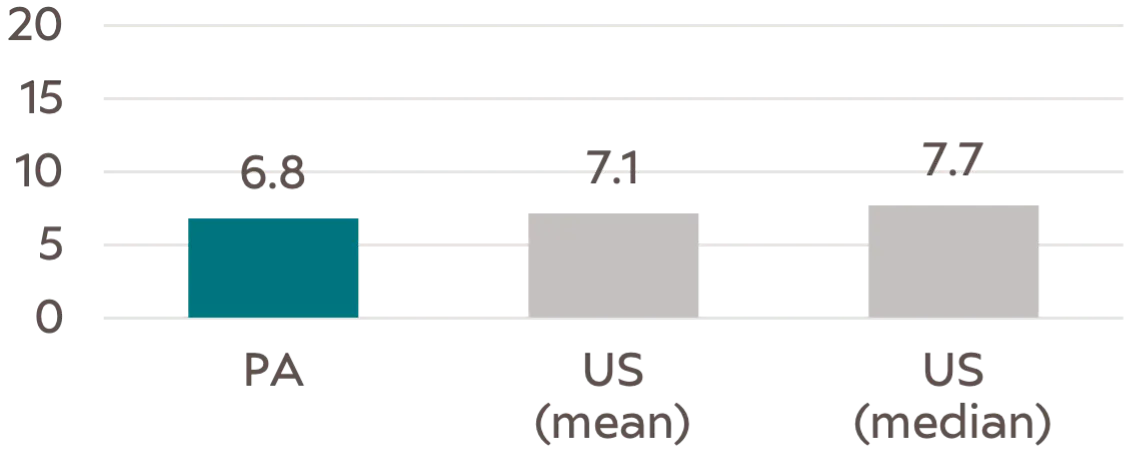
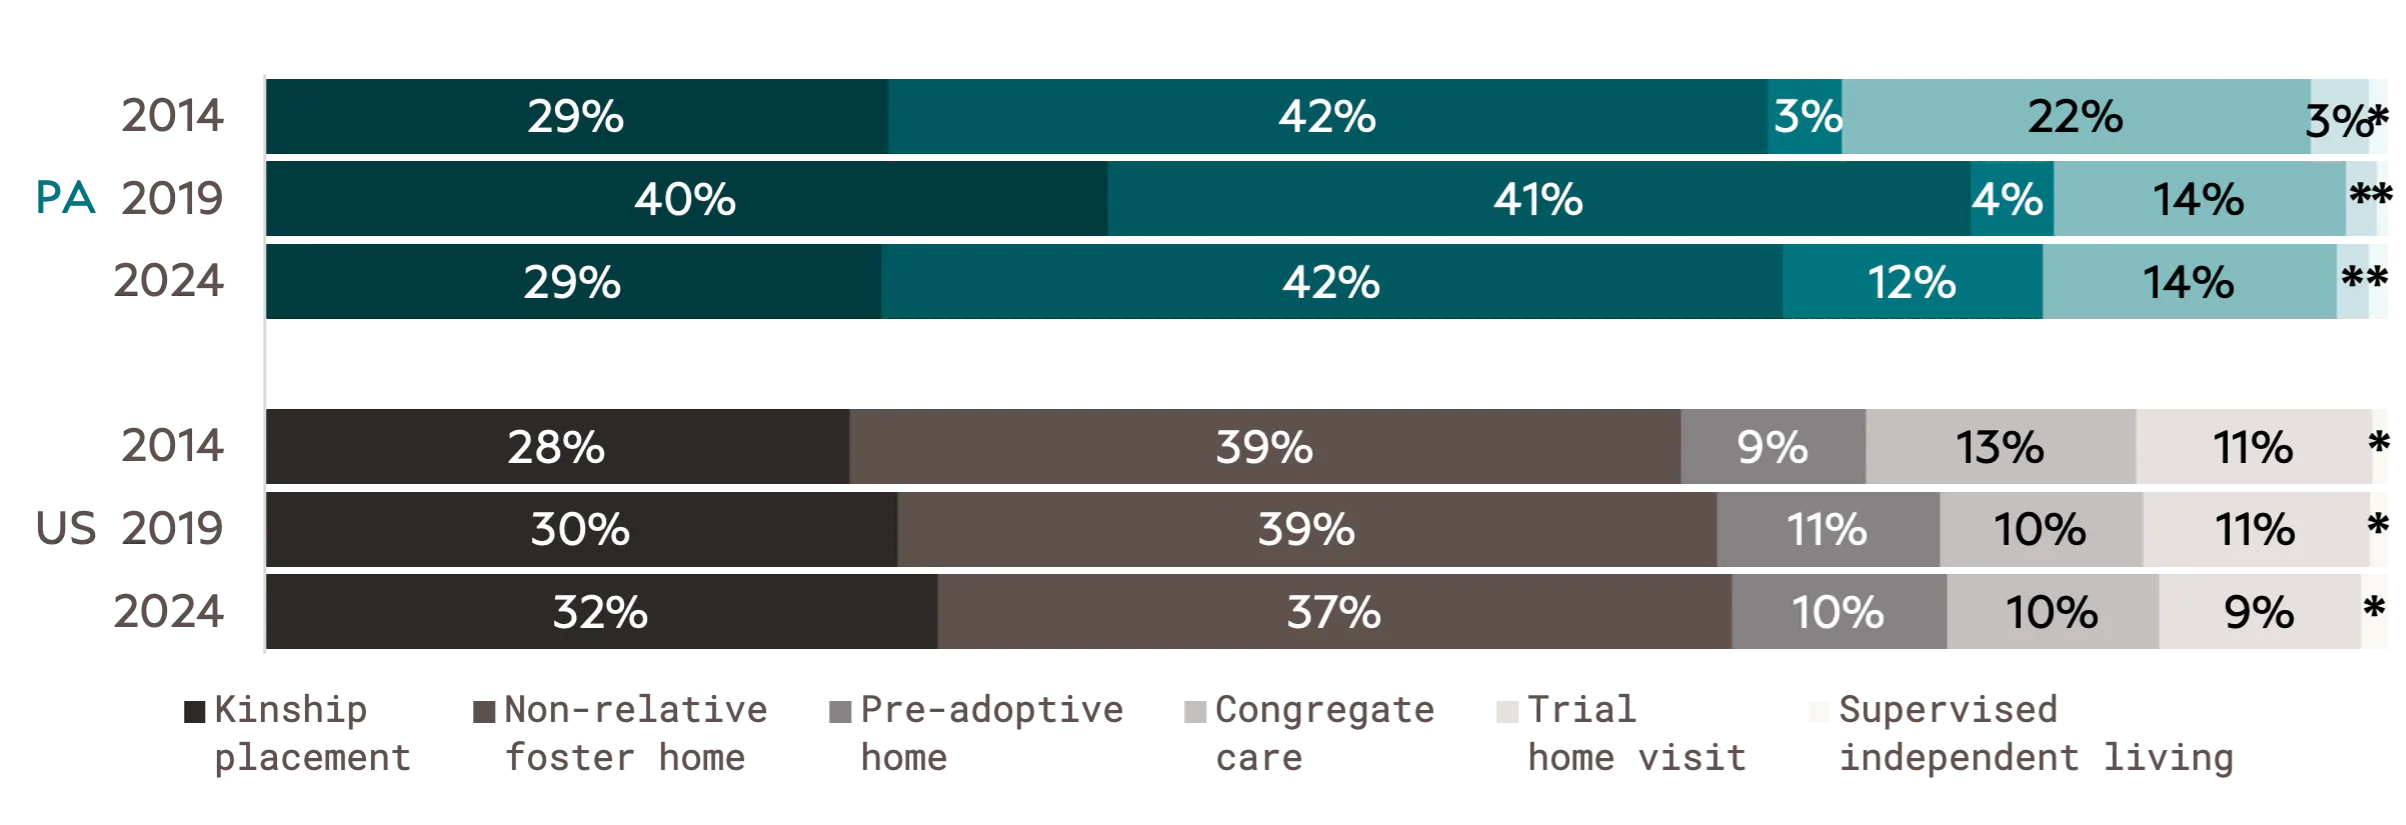
Key Finding: In Pennsylvania, about 16,000 children were placed in foster care in fiscal year 2024. This was about 7 children per 1,000, which is comparable to the U.S. rate. Most children are placed in family-based settings.
Number of Children in Foster Care per 1,000 Child Population, FY 2024
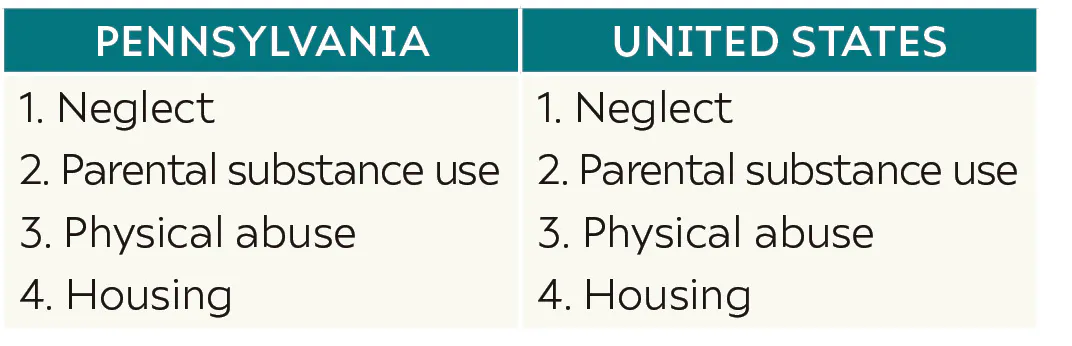
Most Common Reasons for Removal, FY 2024
Placement Settings for Children in Foster Care Across 10 Years (FY 2014, 2019, 2024)
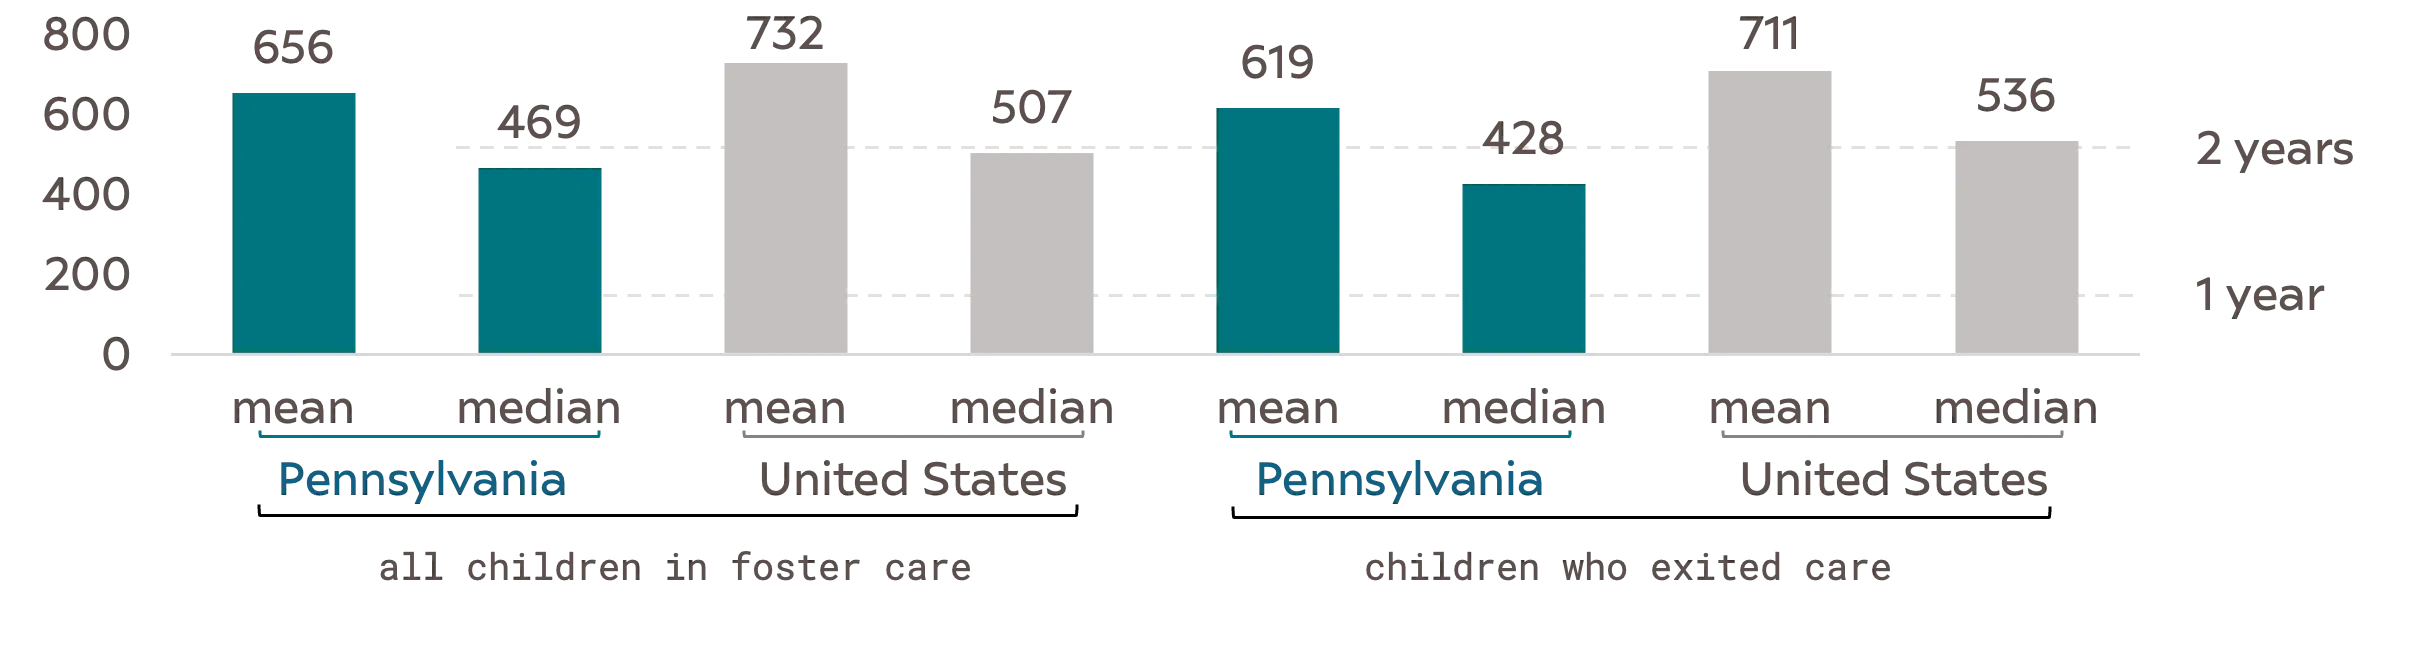
Key Finding: In 2024, the median length of time a child spent it foster care in Pennsyvania was 15 months, compared with the U.S. median of 17 months. For children exiting the foster care system in 2024, the median length of stay was 14 months in Pennsylvania and 18 months for the U.S. as a whole.
Mean and Median Length of Foster Care Stay in Days, 2024
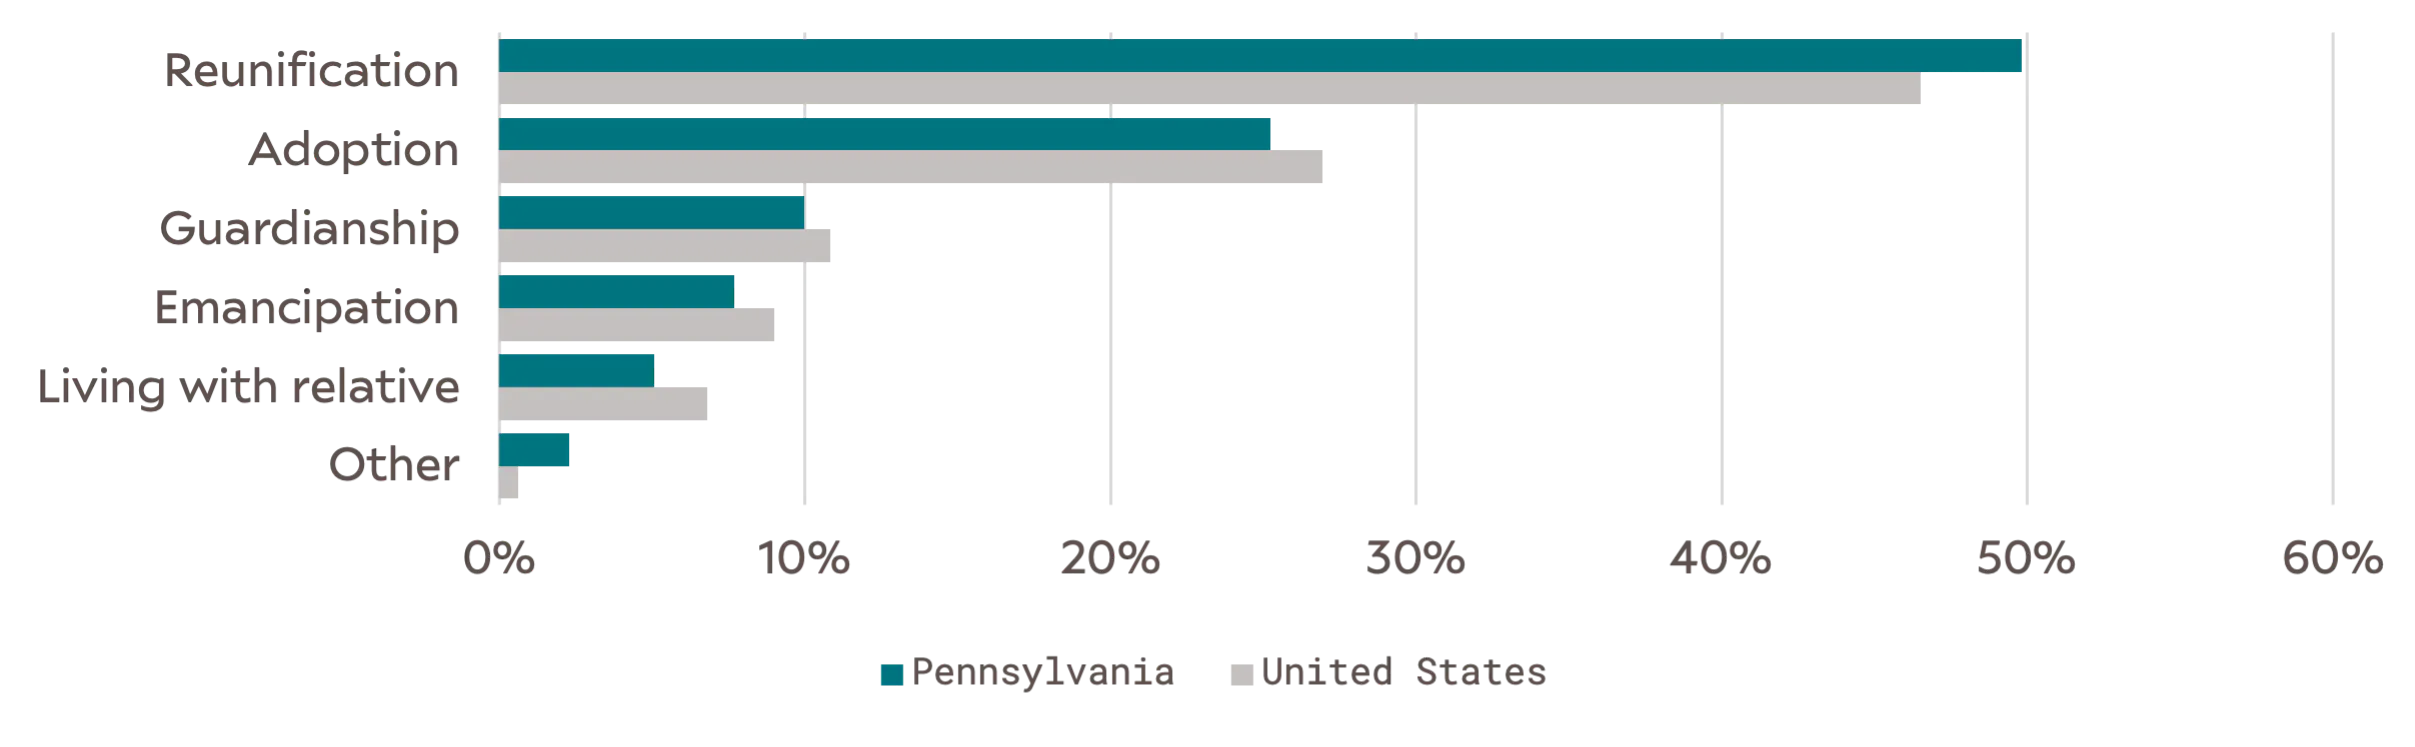
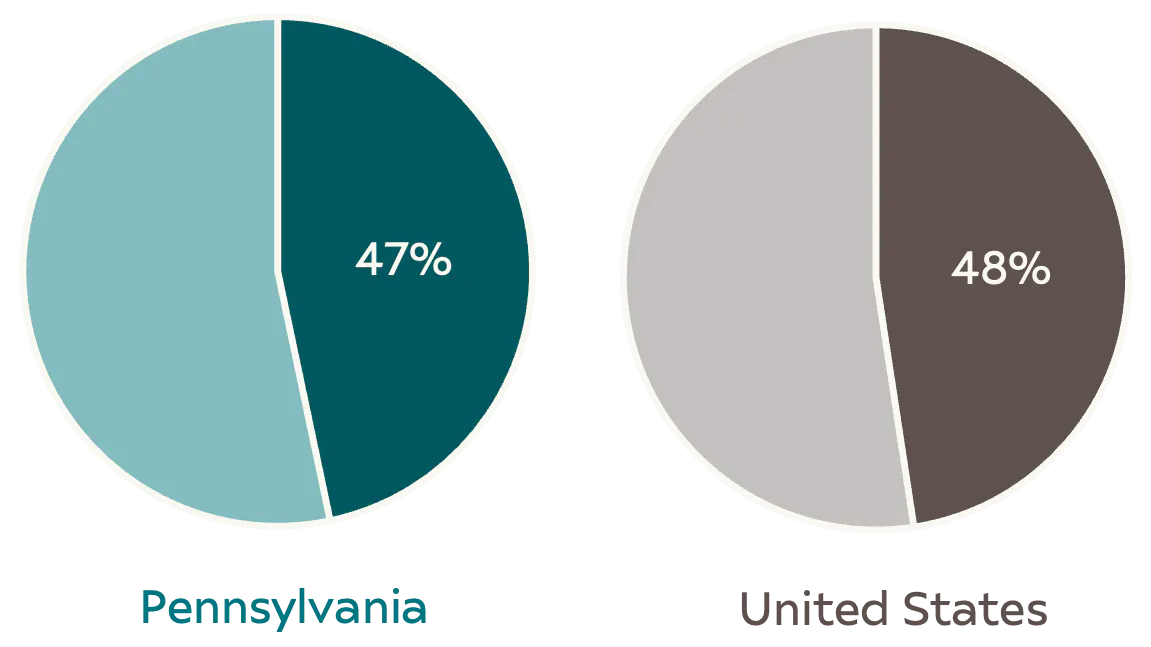
Key Finding: In federal fiscal year 2024, most children in foster care remained in care for the entire year (63% in Pennsylvania; 66% in U.S.). Among children who exited foster care during that year, the most common exits were reunification and adoption, both in Pennsylvania and across the U.S..
Percentage of Children in Foster Care Exiting Care by Exit Type, FY 2024
Percentage of Children in Foster Care Exiting Care by Residence, FY 2024
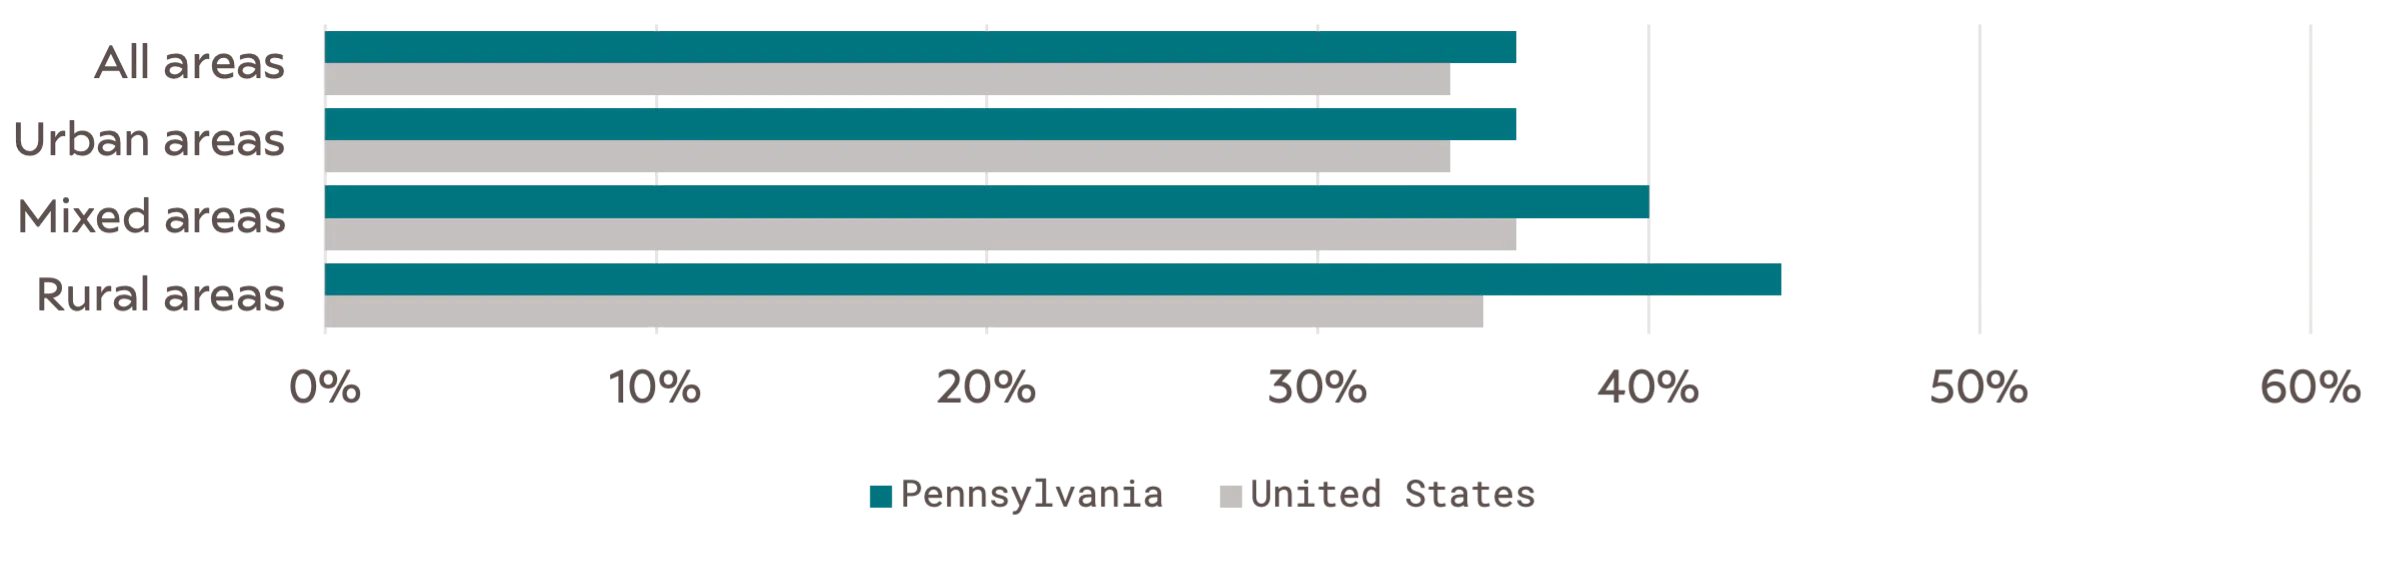
Percentage of Children in Foster Care Aged 16 or Older Aging Out of Care (Emancipation) by Residence, FY 2024

Key Finding: XXXXX
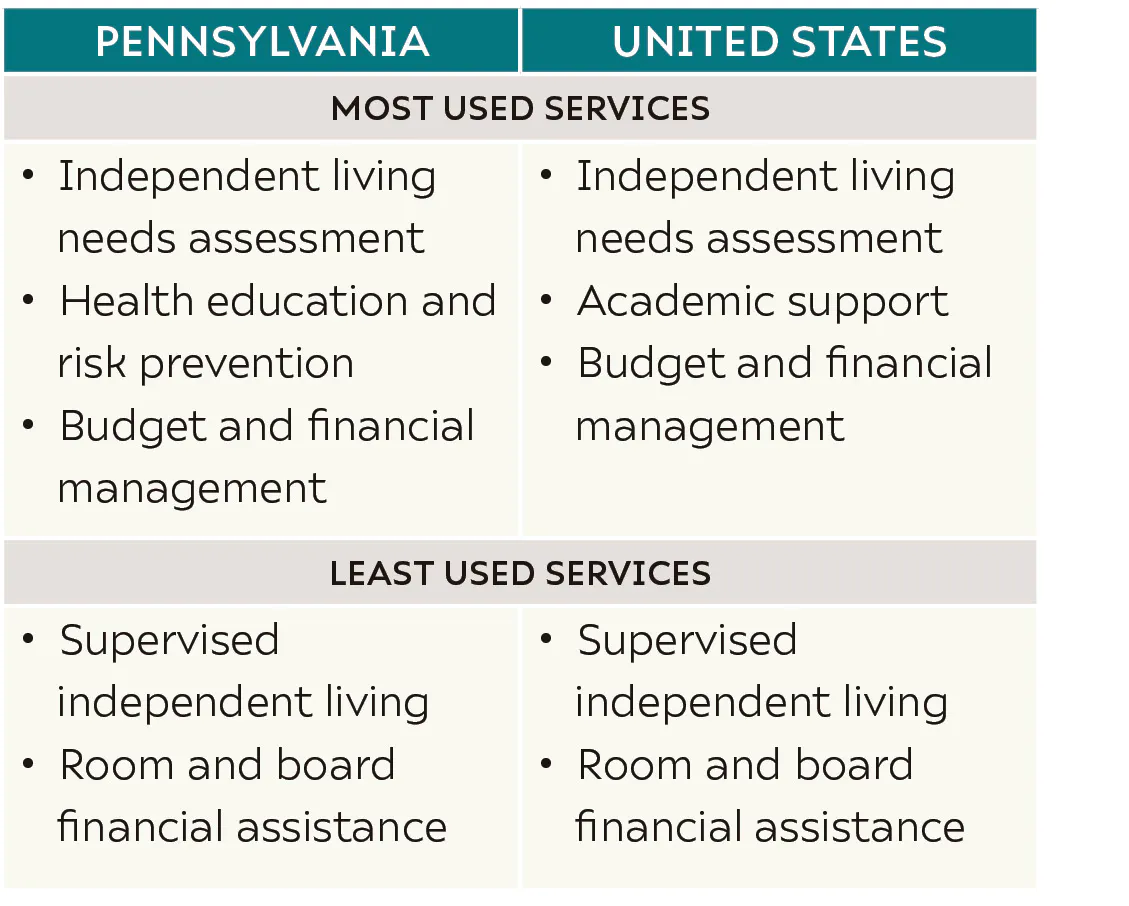
Chafee-Funded Services Used by Youth Aged 17 to 21 in Foster Care, FY 2024?
Percentage of Youth in Foster Care Reporting Stable Housing at Age 21, 2020
This data profile is part of The National State of Child Welfare series. Click the link below for access to supporting materials and data profiles for other states.